I am new to this community. I am master's student at Arizona State University, I am working on a project. In this Project I am planning to apply some optimization techniques to decide optimal pit stop strategy. I am going to use Fuel corrected lap times to calculate tire wear rate for a particular driver. Using tire wear rate I will decide a pit stop strategy which will minimize the total tire wear penalty.
I have calculated Fuel corrected lap times as follows,
1) collected Lap time data from official FIA website
2) converted lap times in seconds
3) Assumed every car started with 105 kgs of fuel (don't know the exact numbers, hence assumed the number)
4) Assumed fuel consumption rate of 1.66 kgs/lap ( don't know the fuel efficiency of each car, hence assumed the number)
5) Assumed fuel weight penalty of 0.0307 seconds/kg of fuel i.e. each kg of fuel adds penalty of 0.0307 seconds. We can say that time penalty per lap of fuel is 0.051 seconds
6) For a lap, took average of fuel weights at the start of the lap and fuel weight at the end of the lap, for eg. for the 1st lap, fuel weight at the start of the lap is 105 kgs and fuel weight at the end of the lap is 105-1.66=103.34 kgs, so the avg fuel weight for the lap is 104.17 kgs, so time penalty due to fuel weight for the first lap is 3.198019 seconds.
7) Similarly, calculated time penalty due to fuel weight for all the laps
8 ) Calculated fuel-corrected times for all the laps by subtracting fuel weight penalty from lap times in seconds
I have done fuel-corrected lap time calculations for Lewis Hamilton, Sebastian Vettel, Max Verstappen, Felipe Massa.
Let's consider fuel-corrected lap time analysis of Lewis Hamilton's second stint,
Hamilton pitted on 17th lap and changed to soft tires, I didn't consider 17th and 18th lap times in my analysis because 17th lap involves pit stop and pit lane entry time and 18th lap involves pit lane exit time. Following are the fuel-corrected lap times for 2nd stint,
Lap Fuel corrected lap times
19 85.270297
20 86.243259
21 86.802221
22 87.751183
23 87.380145
24 89.448107
25 88.331069
26 86.028031
27 85.960993
28 86.023955
29 86.041917
30 86.811879
31 86.597841
32 86.092803
33 85.980765
34 87.457727
35 85.969689
36 86.939651
37 86.348613
38 86.245575
39 86.356537
40 86.314499
41 87.560461
42 86.364423
43 87.784385
44 86.026347
45 86.195309
46 86.442271
47 86.431233
48 86.525195
49 87.311157
50 88.288119
51 87.118081
52 87.008043
53 86.539005
54 87.801967
55 87.049929
56 87.131891
57 87.797853
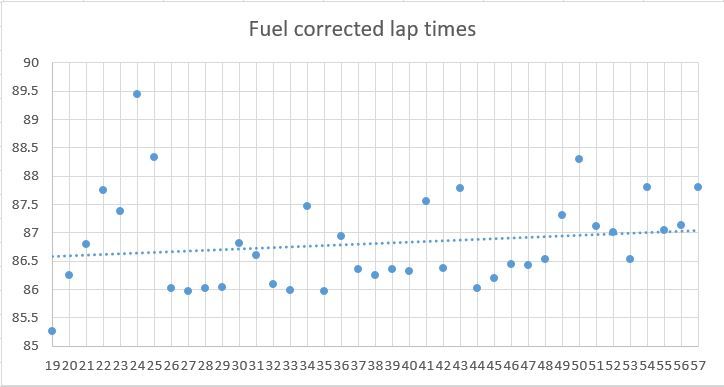
I plotted this data to scatter plot on MS Excel and added trendline,
 [/img]
I think the increasing trend of lap time is due to tire wear. I am assuming that the trendline is fitting the data and is removing the variability due to driver skills and other factors.
In this way, I noticed a similar increasing trend in fuel-corrected lap times for all the drivers I have mentioned.
I have few questions and I think your responses will help to improve the analysis.
Using Statistical method, I will fit the data and will calculate tire wear rate for every driver and tire compound using multiple race data.
Questions:
1) Is there any source where I can get fuel efficiency of the car, starting fuel weight of the cars?
2) any comments on my fuel weight penalty assumption?
3) any comments on my method of calculating fuel-corrected lap time calculations?
4) Can we assume increasing trend in fuel-corrected lap times is due to tire wear only? I think trendline in Excel helps to remove drivers accuracy and skills factor. I will use statistical method for fitting the data in the future.
5) Any other factors I should consider?
6) Any sources with detail analysis of tire wear or pit stop strategy
Few general questions,
1) Any idea how F1 constructors decide pit stop strategies, are these decisions taken instantaneously or are decided before the race.
2) Any website which will give me speed of the car at every section of the track and track temperature during the race
I can share the spreadsheet to those who are interested in understanding the analysis.
I know this is a long post but your responses are very important for my project. I am new to the F1 world and your help means a lot to me. Thank you and looking forward to an interesting discussion.
Thanks,
Viral Patel