2014 transmissions

All that has to do with the power train, gearbox, clutch, fuels and lubricants, etc. Generally the mechanical side of Formula One.
User avatar
rscsr
51
Joined: 19 Feb 2012, 13:02
Location: Austria

Re: 2014 transmissions

Post

Juzh wrote:
321apex wrote:My purely theoretical analysis for gear ratios would go as follows while having 2200 RPM spread:
8th - 1.0 - 279-344 km/h
7th - 1.23 - 227-279
6th - 1.52 - 184-227
5th - 1.87 - 149-184
4th - 2.30 - 121-149
3rd - 2.83 - 99-121
2nd - 3.49 - 80-99
1st - 4.30 - to 80 km/h

is this close to what you are getting?
Simple logic tells me this is far from what will actually be used. There's no way 8th gear will span 279-344kmh. Especially not with 8 gear transmissions. Nor will 7th for that matter.
It's according to the Cosworth data not far off. I got about 255-350 km/h due to the extremely flat power curve.

mrluke
mrluke
33
Joined: 22 Nov 2013, 20:31

Re: 2014 transmissions

Post

Kozy wrote:
mrluke wrote:
321apex wrote:re: rscsr
Kozy, you appear to have given the V6 a very peaky NA style power curve? Have you used the cosworth data for reference?
It's due to the crude torque curve control, it can only do variations of parabolic curves so it's pretty limited at the moment.

I've been meaning to implement a new version where you can drag points on a chart around to set any shaped curve you like but it's a nightmare to sort out.
I think it is a bad fit for the v6 atm as it cuts out the main strength of the v6, the flat power band. Your chart shows the v6 to have ~630bhp at 10krpm and ~730bhp at 13krpm.

In comparison the Cosworth graph shows ~730bhp at 10k and ~750bhp at 12k and ~740bhp at 13k (according to my interpretation).

Image

This should give a whole heap more drive thrust if I interpret correctly, especially at lower road speeds.

321apex
321apex
12
Joined: 07 Oct 2013, 16:57

Re: 2014 transmissions

Post

rscsr wrote:
Juzh wrote:
321apex wrote:My purely theoretical analysis for gear ratios would go as follows while having 2200 RPM spread:
8th - 1.0 - 279-344 km/h
7th - 1.23 - 227-279
6th - 1.52 - 184-227
5th - 1.87 - 149-184
4th - 2.30 - 121-149
3rd - 2.83 - 99-121
2nd - 3.49 - 80-99
1st - 4.30 - to 80 km/h

is this close to what you are getting?
Simple logic tells me this is far from what will actually be used. There's no way 8th gear will span 279-344kmh. Especially not with 8 gear transmissions. Nor will 7th for that matter.
It's according to the Cosworth data not far off. I got about 255-350 km/h due to the extremely flat power curve.
I corrected my gear ratio and speed estimates based upon some gear/speed data:
http://www.f1technical.net/forum/viewto ... start=4245

8th - 1.0 - 279-344 km/h -------- [1.00 --- 308-334 km/h]
7th - 1.23 - 227-279 -------- [1.09 --- 266-308 km/h]
6th - 1.52 - 184-227 -------- [1.26 --- 234-266 km/h]
5th - 1.87 - 149-184 -------- [1.43 --- 205-234 km/h]
4th - 2.30 - 121-149 -------- [1.63 --- 179-205 km/h]
3rd - 2.83 - 99-121 -------- [1.87 --- 145-179 km/h]
2nd - 3.49 - 80-99 -------- [2.30 --- 118-145 km/h]
1st - 4.30 - to 80 km/h -------- [2.83 --- 96-118 km/h]

Kozy
Kozy
8
Joined: 05 Jul 2010, 13:52

Re: 2014 transmissions

Post

mrluke wrote:
I think it is a bad fit for the v6 atm as it cuts out the main strength of the v6, the flat power band. Your chart shows the v6 to have ~630bhp at 10krpm and ~730bhp at 13krpm.

In comparison the Cosworth graph shows ~730bhp at 10k and ~750bhp at 12k and ~740bhp at 13k (according to my interpretation).

http://i.imgur.com/pMHl9vv.jpg

This should give a whole heap more drive thrust if I interpret correctly, especially at lower road speeds.
I have been working on this new curve control idea today but it has failed me massively.

The idea is to have a chart as an input, where you drag the points of the torque curve in say 500rpm intervals. I'll report back when I figure it out.

autogyro
autogyro
53
Joined: 04 Oct 2009, 15:03

Re: 2014 transmissions

Post

I have been working on this new curve control idea today but it has failed me massively.

The idea is to have a chart as an input, where you drag the points of the torque curve in say 500rpm intervals. I'll report back when I figure it out.
I like your idea for a variable graph as a basic tool.
However an accurate graph will take you a very long time.
There are a huge number of variables and many engineers have been trying to achieve such an ideal ever since the 19th century.

Kozy
Kozy
8
Joined: 05 Jul 2010, 13:52

Re: 2014 transmissions

Post

autogyro wrote: I like your idea for a variable graph as a basic tool.
However an accurate graph will take you a very long time.
It doesn't need to be be amazingly accurate, I'm making free educational resource tools for hobbyists and enthusiasts so simplicity is key. If people want professional level accuracy, there are software programs with 5 figure price tags and a plethora of ultra confusing inputs that fill that market.

This is simply a step up from using Excel spreadsheets. :D

I am getting somewhere with the idea though, I've got it rendering and dynamically updating inputs. Just can't get it to talk to the calculations at the moment.

Works a bit like this: http://jsfiddle.net/ZQQpS/28/ (drag the blue line, the black one and the inputs above the chart update with it.)
autogyro wrote: There are a huge number of variables and many engineers have been trying to achieve such an ideal ever since the 19th century.
They were trying to create variable input javascript charts in the 19th century? Learn something new every day! :wtf:

vtr
vtr
7
Joined: 24 Jan 2014, 22:42

Re: 2014 transmissions

Post

Kozy wrote:
It doesn't need to be be amazingly accurate, I'm making free educational resource tools for hobbyists and enthusiasts so simplicity is key. If people want professional level accuracy, there are software programs with 5 figure price tags and a plethora of ultra confusing inputs that fill that market.

This is simply a step up from using Excel spreadsheets. :D
Nice work, but have you heard of GeoGebra? http://en.wikipedia.org/wiki/GeoGebra It is a free geometry/algebra/spreadsheet program that I have used a few times in my course work, and I think it is awesome to do those interactive graphics. The spreadsheet part is not as good as Excel, but you can make it work. Also, it can be used in a browser at http://web.geogebra.org/app/

For example, I adapted something I did for school to get the tractive force graph with rscsr's drag assumptions and cosworth's engine power data, so one can edit the engine power curve and the gear ratios using sliders.

Here's the file (only 23kb):
https://www.dropbox.com/s/0miutijjhlcvc ... rtrain.ggb

Just open http://web.geogebra.org/app/, and when it opens click file->open->open, and select the ggb file on the link above. The window should look like the screenshot below. If an algebra or spreadsheet frame window opens, you can just close them (or keep them open and look at the mess I made to make it work lol)

Image

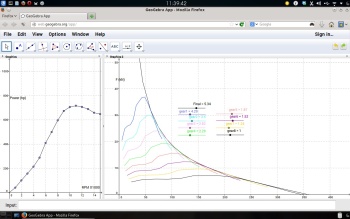
Edit: I forgot to write that the engine power curve is adjusted with the blue dots in the power curve. They move vertically, and the x coordinates are 1000rpm, 2000rpm, ... 15000rpm.