Speed trap statistics

Post here all non technical related topics about Formula One. This includes race results, discussions, testing analysis etc. TV coverage and other personal questions should be in Off topic chat.
TzeiTzei
5
Joined: 09 Mar 2011, 21:19

Speed trap statistics

Post

I was curious of how different engines are performing in races, so I thought I'd take a look behind the rather simplistic speed trap figures that FIA releases after each race.

What I've basically done is that using the F1 app I have taken the top speed from each team on each lap of the race and calculated an average from that. To make sure that slipstreaming or DRS doesn't affect the results, I've only taken laps where the gap to the car in front is at least 2 seconds.

https://drive.google.com/open?id=0B8Xfq ... Xg3UkdWOXM

The data would suggest that the Mercedes PU has a clear advantage in races. And actually the Ferrari PU would seem to be further behind than in qualifying.

For comparison, here are the speed trap averages from qualifying this season:

1. Force India 320,6 km/h
2. Mercedes 320,5
3. Williams 319,9
4. Ferrari 319,5
5. Haas 316,9
6. Red Bull 316,8
7. Toro Rosso 314,9
8. Renault 314,2
9. Sauber 313,1
10. McLaren 310,6

The race speed traps also shine light on some of the problems Honda are facing. Looking just at the speed trap figures on FIA's documents gives the false impression I sometimes see in internet discussions that they are pretty close to Renault. Looking at their speed lap by lap it becomes clear very quickly that either they are having to save a lot of fuel in the races or their ERS simply runs out of battery power on some tracks. Maybe both. Sometimes they can be 10-20 km/h down on everybody else for some parts of the race.

I don't know. Lies, damned lies, statistics?

VivecF1
0
Joined: 17 Oct 2017, 13:20
Location: The Netherlands
Contact:

Re: Speed trap statistics

Post

Don't forget that 'a powerful or efficient engine' is not always the fastest one. And even the fastest on, might not be... at the end of a lap ;-).

Enough abstract bs.

The Mercedes PU might be best in producing the much needed torque and speed, but overall Ferrari might have an engine which is more dynamic and picks up better after the corner exit?!
This is just assumption of course.
There must be a reason as to why many now say that the Ferrari PU is the one to beat...
Formula 1 Racing Statistics - Compare Formula 1 data

bill shoe
151
Joined: 19 Nov 2008, 08:18
Location: Dallas, Texas, USA

Re: Speed trap statistics

Post

TzeiTzei wrote:
08 Oct 2017, 15:04

The race speed traps also shine light on some of the problems Honda are facing. Looking just at the speed trap figures on FIA's documents gives the false impression I sometimes see in internet discussions that they are pretty close to Renault. Looking at their speed lap by lap it becomes clear very quickly that either they are having to save a lot of fuel in the races or their ERS simply runs out of battery power on some tracks. Maybe both. Sometimes they can be 10-20 km/h down on everybody else for some parts of the race.

I don't know. Lies, damned lies, statistics?
Nice info, and good analysis. The only problem is that you've presented it very clearly and therefore left us very little room to argue about it :)

Just_a_fan
591
Joined: 31 Jan 2010, 20:37

Re: Speed trap statistics

Post

Doesn't account for drag levels. It's possible that the Mercedes engines cars have less drag, either by design or by virtue of missing downforce. We know Mercedes claim to aim for efficiency rather than maximum downforce. We know that Williams are likewise slippery but lack total downforce.

Back in the day, Minardi regularly topped the speed traps. They had much less downforce than most other teams and hence less drag. They also had no pace on a lap.

In summary, you've tried to use one data point to prove a hypothesis.
If you are more fortunate than others, build a larger table not a taller fence.

User avatar
GPR-A duplicate2
64
Joined: 07 Aug 2014, 09:00

Re: Speed trap statistics

Post

TzeiTzei wrote:
08 Oct 2017, 15:04
The data would suggest that the Mercedes PU has a clear advantage in races. And actually the Ferrari PU would seem to be further behind than in qualifying.
Top speeds are not representative of the performance of an engine. It is one of the many parameters. One of the simplest thing that affect a car reaching highest top speed is the drag. The more downforce a car carries, the more draggy it becomes and hence, scores low in speed traps.
VivecF1 wrote:
17 Oct 2017, 15:40
The Mercedes PU might be best in producing the much needed torque and speed, but overall Ferrari might have an engine which is more dynamic and picks up better after the corner exit?!
This is just assumption of course.
There must be a reason as to why many now say that the Ferrari PU is the one to beat...
Nothing that we have seen so far in the season, establishes Ferrari as the PU to beat. One thing that is established however is, Ferrari doesn't carry the same juice for the longest amount of time as Mercedes does. Simplest evidence of this factor was there to be seen in Spa, after the SC restart. Lewis on harder compound (difficulty in switching on) and Vettel on softer compound (relatively better to switch on), Ferrari gets a small slipstream, the cars come side by side and by the time the breaking zone arrives, Mercedes is ahead. So no, Ferrari still has some distance to go to be the best PU.
https://www.youtube.com/watch?v=UPugtFTbDt4

As for corner exit is concerned, it has more to do with mechanical grip of the car that can take as much torque and not cause wheel spin. Every PU out there produces almost similar levels of torque for almost all gears (including Honda), so that has not got anything to do with power on corner exit. It's of no use if you can generate 1000 bhp in first gear and all it does is, generate massive wheel spin as the mechanical grip of the car is poor. Read this forum for Gear Ratios for 2017. https://www.f1technical.net/forum/viewtopic.php?t=26230

However what distinguishes a PU is, how early a car reaches the max power and HOW LONG IT SUSTAINS THAT POWER (with the help of ERS). That is the example I gave from Spa. The following snap is when Vettel was right beside Hamilton at Kemmel straight after the SC restart. Look at the ERS available at the same point in time for either car.

Image
Last edited by GPR-A duplicate2 on 18 Oct 2017, 07:28, edited 2 times in total.

User avatar
Phil
66
Joined: 25 Sep 2012, 16:22
Contact:

Re: Speed trap statistics

Post

Just_a_fan wrote:
17 Oct 2017, 16:42
Doesn't account for drag levels.
From my basic understanding, top-speed is a function of power and drag. Meaning that no matter how fast the car accelerates, it will eventually get there and when it does, the top-speed is a simple byproduct of drag and power.

However, there's one factor: Acceleration and distance. A typical F1 circuit isn't a drag strip with an infinite straight. So acceleration is a factor too. E.g. a better power/weight (and yes drag too) will account to how fast the object can accelerate on a straight with a specific length. Of course, one also has to take into account the starting speed (exit corner speed of the corner before).

So even assuming Mercedes has less drag than their competitors due to more efficient aero, I'm still pretty sure general top-speed stats can give us more of an indication of overall PU performance, because the acceleration to that top-speed on a typical straight of lets say 600-1000m will be a key point too.

So the question is: How different would the drag levels be between teams that are comparable over a length? What difference can we assume between power-units?

It seems to be generally accepted that Mercedes has the "most powerful PU" and the least drag (as a result of going for efficiency). If this were the case, I would expect Mercedes to have generally and significantly higher top-speeds than Ferrari. Yet, they don't, at least not in qualifying if I am not mistaken...?

Some food for thought.
Not for nothing, Rosberg's Championship is the only thing that lends credibility to Hamilton's recent success. Otherwise, he'd just be the guy who's had the best car. — bhall II
#Team44 supporter

Just_a_fan
591
Joined: 31 Jan 2010, 20:37

Re: Speed trap statistics

Post

Phil wrote:
17 Oct 2017, 19:15
Just_a_fan wrote:
17 Oct 2017, 16:42
Doesn't account for drag levels.
From my basic understanding, top-speed is a function of power and drag. Meaning that no matter how fast the car accelerates, it will eventually get there and when it does, the top-speed is a simple byproduct of drag and power.
Power absorbed by drag increases with the cube of the speed. This relationship might allow a further analysis...
If you are more fortunate than others, build a larger table not a taller fence.

mrluke
33
Joined: 22 Nov 2013, 20:31

Re: Speed trap statistics

Post

Top speed in f1 is almost entirely drag dependent.

There is a very long discussion between myself and bhall about it in the pu thread.

At the time the discussion was trying to compare the v10 engines against the v6t but it's much the same as the discussion here. We even went to worked examples using different drag levels and bhp levels to calculate the impacts.

Long and short it's all about drag.

You also have to remember that a car/team do not have a fixed downforce/drag level. They can be anywhere from a minimum drag to max down force setup and at each point on that curve different teams will have different overall efficiencies. This could mean (as an illustrative example) that Ferrari get the best lap time on a particular circuit running 70pc of their max downforce while Mercedes might run 75pc of their max but still have a lower drag level than Ferrari.

Then you could have sauber running a 30pc Downforce setup but still making more drag than both Ferrari and Mercedes. With Mclaren running a 95pc max downforce at much higher drag levels than everybody else but making their optimum lap time.

Your next level of complication is that the teams are very clever around losing downforce/drag as car speed increases. Ideally you want the minimum possible downforce/drag once you are travelling faster than the max corner speed and you want max downforce for the slower corners. I daresay teams like rbr and Mercedes are the best at shedding drag with speed and this is probably a large part of the reason for the vmax deltas (I speculate).

marmer
1
Joined: 21 Apr 2017, 06:48

Re: Speed trap statistics

Post

Would the best way to find the engine ability be to monitor the time taken to get from 100mph to 200mph in a straight line.

This would remove the potential for speed to be affected by corner performance and difference in mechanical grip.

Yes drag would still be effecting the results I know .but drag levels are not that different at the top teams and only an issue with ernonius results when a team is clearly compensating for a loss of power i.e McLaren and red bull at select tracks

mrluke
33
Joined: 22 Nov 2013, 20:31

Re: Speed trap statistics

Post

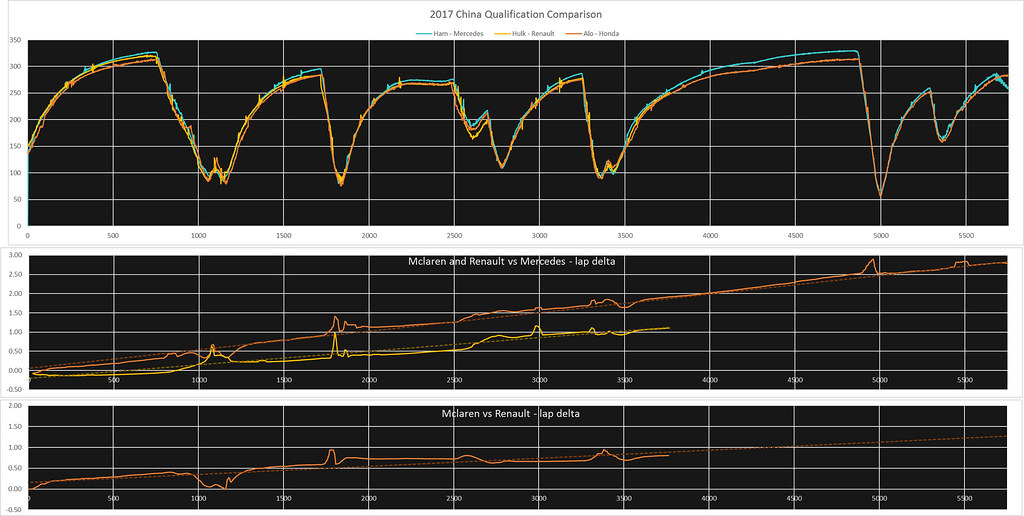
Here is a speed v distance trace for China qualy from this year. See what you think.

Image2017 China Qualification DeltaTrace by luke bloggs, on Flickr

Up to 250km/h I struggle to see much difference between them.

JAA17
0
Joined: 25 Aug 2017, 20:34

Re: Speed trap statistics

Post

I do not know. That blue line gap seems enormous to me (I am a mathematician). Your graphs easily show why Mercedes is at the top of the pile with such dominance. Remember, we are only taking a second or so really per lap, maybe about 1% of lap time. That kind of advantage in a 40 lap race is a major advantage.
[Alonso Fan]

User avatar
rscsr
51
Joined: 19 Feb 2012, 13:02
Location: Austria

Re: Speed trap statistics

Post

JAA17 wrote:
20 Oct 2017, 23:09
I do not know. That blue line gap seems enormous to me (I am a mathematician). Your graphs easily show why Mercedes is at the top of the pile with such dominance. Remember, we are only taking a second or so really per lap, maybe about 1% of lap time. That kind of advantage in a 40 lap race is a major advantage.
The only thing that these graphs show is a drag advantage. There is basically no difference in the acceleration and therefore there can't be a significant peak power difference since the equation for the acceleration basically has the shape of

stevesingo
42
Joined: 07 Sep 2014, 00:28

Re: Speed trap statistics

Post

To me it could show the reduced deployment as the speed rises. If you have limited deployment to MGU-K due to uncompetitive recovery from the MGU-H, the deployment of MGU-K is best done at lower speed when pushing against a lower drag induced force.

TzeiTzei
5
Joined: 09 Mar 2011, 21:19

Re: Speed trap statistics

Post

RACE SPEED TRAP AVERAGE 
				AVG	AUS  	BAH  	CHI  	AZE
1.  Force India-Mercedes	305,4	295,0	304,6	310,8	311,2
2.  Mercedes			304,4	292,7	302,9	311,0	310,8
3.  Williams-Mercedes		300,6	290,3	297,1	308,5	306,4
4.  Haas-Ferrari		300,6	289,3	296,2	310,1	306,8
5.  Red Bull-Renault		300,4	291,1	296,0	306,8	307,6	
6.  Sauber-Ferrari		300,2	289,0	298,3	309,9	303,4
7.  Ferrari			299,9	291,3	298,4	306,9	303,0
8.  Renault			296,6	290,1	284,2	307,3	304,9
9.  McLaren-Renault		296,3	286,6	287,1	307,4	304,1
10. Toro Rosso-Honda		292,9	282,9	284,1	305,3	299,3
Out of curiosity decided to do this this year as well. It's an average of the speed trap speed in the race from every lap. In trying to remove DRS and tow from the data, I've only used laps where there is at least a 2 second gap to the car infront. The faster car from any team on that lap will count.

Red Bull's average is probably a bit higher than what it should be. In Bahrain they only got 1 lap in early in the race before both cars were out. Other Renault powered cars were fast too early in the race but slowed down significantly as the race progressed. The RBs never got that far.

There is a bit of a pattern emerging here, where the cars are in the order of their engine manufacturer. Even when taking into account different set ups, drag etc. that's still quite a coincidence. In qualifying Ferrari seem to be able to match Mercedes on straigh line speed, but in the races they are consistently a few kph slower. Fuel saving? Inability to recover enough energy in a sustainable race mode? Or maybe they're burning more oil in the qualifying mode like was rumoured in the engine tread?

Toro Rosso's have looked good in top speed charts but on average they have the slowest car on the straights. And they're consistently the slowest cars out there.

User avatar
Callum
6
Joined: 18 Jan 2009, 15:03
Location: Edinburgh, Scotland

Re: Speed trap statistics

Post

TzeiTzei, you have raised a really interesting point - How does the speed trap data generally vary as a proportion of race distance? Would that be too time consuming to work out?

It would be interesting if, for example, if Renault dropped ~ 2% top speed over the race distance but Ferrri dropped 5% etc, or if the 75% lap count for each race came and there was a step-change in top speed.

Post Reply