Ride height maps for a generic open wheeled car

Post here all non technical related topics about Formula One. This includes race results, discussions, testing analysis etc. TV coverage and other personal questions should be in Off topic chat.
RACKITUP
RACKITUP
0
Joined: 23 Apr 2006, 18:27

Ride height maps for a generic open wheeled car

Post

I have recently has a wind tunnel test with a 50% scale F1 car.


I am having problems with ride height maps. Does anyone have any links to that might shed some light on how one would got about plotting a map, or what it should look like.

Regards,

Mark


Below is an example, I have copy and pasted from excel, sorry if it screws up
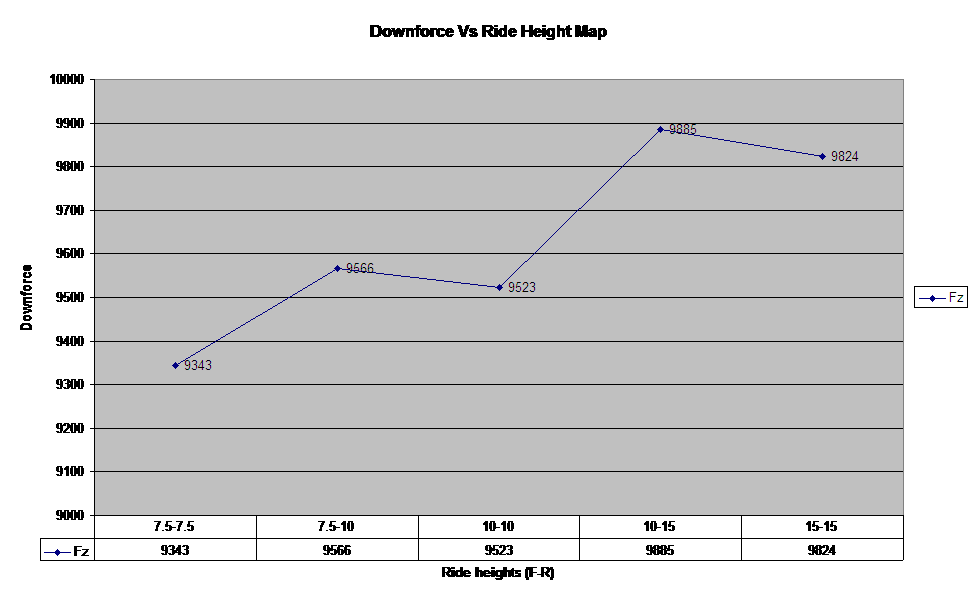

Ride Height

Front Rear Total Downforce
7.5 7.5 9343
7.5 10.0 9566
10 10 9523
10 15 9885
15 15 9824

pompelmo
pompelmo
0
Joined: 22 Feb 2004, 16:51
Location: Lucija, Slovenia

Post

Front Rear Total Downforce
7.5 7.5 9343
7.5 10.0 9566
10 10 9523
10 15 9885
15 15 9824
what these numbers mean??

AeroGT3
AeroGT3
0
Joined: 29 Mar 2006, 23:22

Post

It should be a parabolic curve, sort of. If those ride heights are tray height above the ground, you need to go greater than 15mm to really catch the curve's shape.

We need more info in what those numbers are to understand them.

RACKITUP
RACKITUP
0
Joined: 23 Apr 2006, 18:27

Re: Ride height maps for a generic open wheeled car

Post

Ride Height is simply the height at the front and rear wheel centreline as if the undertray was extended to those parts

Downforce is total downforce
Front_____Rear_____Total Downforce
7.5________7.5_______9343
7.5________10.0______9566
10________10.0_______9523
10________15.0_______9885
15________15.0_______9824

scarbs
scarbs
393
Joined: 08 Oct 2003, 09:47
Location: Hertfordshire, UK

Post

How about...


Image

BreezyRacer
BreezyRacer
2
Joined: 04 Nov 2006, 00:31

Post

Are these dimensions the actual gap between the ground and the floor (reference plane) of the actual 50% model? If so I take it they are MM?

Are you using a metal rolling road in the tunnel? If not a metal rolling road are you measuring any floor deflection?

What velocities did you test at?

When ride heights get too low airflow under the car is restricted to the point where the diffuser cannot fully function, thus a drop in DF. Raking the car, as in under braking increases the diffuser effect along the undertray.

Also instead of overall DF numbers it would be much better to see Front/Rear DF numbers, along with center of force. You should be able to see the center of force move forward a bit when the car is raked.
Last edited by BreezyRacer on 05 Jan 2007, 17:51, edited 1 time in total.

Reca
Reca
93
Joined: 21 Dec 2003, 18:22
Location: Monza, Italy

Post

There are at least two possible graphs to put them down in a readable way and here you have them with your data :
[IMG:150:128]http://img401.imageshack.us/img401/7894 ... pb6.th.jpg[/img]

The left one is a 3d area graph, the right one is a coloured surface. The latter is pretty useless in your case because you have few points and the map isn’t complete so the former is a better choice, but when you have a point for each combination of front and rear ride height the latter becomes more useful (each colour indicates that that part of graph is in a given downforce interval) as you can see from this example :
[IMG:150:91]http://img401.imageshack.us/img401/2952 ... tx4.th.jpg[/img]

To make them with excel you just have to make different series of values of downforce in function of rear ride height, one per value of front ride height. You’ll see that it’s quite easy and once you made the graph to switch from one to the other is immediate, just right click on it and change “graph type”.

SoftBatch
SoftBatch
0
Joined: 29 Jun 2006, 21:53
Location: Madison, AL, USA

Post

What unit are those downforce numbers in, Newtons?

RACKITUP
RACKITUP
0
Joined: 23 Apr 2006, 18:27

Post

cheers guys, I had been thinking along the lines of reca, and managed this in the end. Although it is only accurate along the line that runs down the middle, it was still better than any 2D plot, and depicted it alot better...hopefully that will be reflected in the marks

thank you too scarbs for taking your time to do that

regards

[IMG:743:660]http://i131.photobucket.com/albums/p314 ... r28/wt.jpg[/img]