Torque and RPM relation

All that has to do with the power train, gearbox, clutch, fuels and lubricants, etc. Generally the mechanical side of Formula One.
User avatar
strad
117
Joined: 02 Jan 2010, 01:57

Re: Torque and RPM relation

Post

xpensive..
A certain Mod will have a fit over you just posting that picture..at least if he's even handed, but from my point of view a picture being worth a thousand words was never more apt.
and
Just-a-Fan I'd give ya more than a single point if I could :wink:
This whole thing has gone stupid.
To achieve anything, you must be prepared to dabble on the boundary of disaster.”
Sir Stirling Moss

wuzak
wuzak
446
Joined: 30 Aug 2011, 03:26

Re: Torque and RPM relation

Post

machin wrote:Don't like maths?

Well, below is a chart showing the results of 27 road tests conducted by Autocar magazine. The graph shows flywheel torque/ton on the x-axis and 30-70mph acceleration on the y-axis. You can see that there is almost no correlation between flywheel torque and acceleration:-

http://www.competition-car-engineering.com/TvsAccel.jpg

If we now take the result of those exact same cars, but display the relationship between flywheel power/ton and 30-70mph acceleration, we can see that there is a very strong correlation. In fact, if we only know the power/ton figure we will be able to fairly accurately predict a car's 30-70mph acceleration time:-

http://www.competition-car-engineering.com/PvsAccel.jpg

Of course this second chart could just as easily say "lbft x RPM / ton" on the X-axis, showing that whilst flywheel torque alone is a useless figure, torque x rpm is very useful. but in that case you may as well just use power (which is torque x rpm).
I assume those graphs map peak torque and peak power? That really doesn't show anything.

User avatar
machin
162
Joined: 25 Nov 2008, 14:45

Re: Torque and RPM relation

Post

I assume those graphs map peak torque and peak power? That really doesn't show anything.
You say it doesn't mean anything? Except that you can see from this chart, that if you only know two bits of data about a car (peak power and vehicle mass) you can very accurately estimate its 30-70mph acceleration:

Image

You could estimate it within maybe +/-0.5 seconds...

Of course, to get a more accurate figure than that you would need to know the full power curve, the gear ratios, the vehicle drag, the weight distribution, etc. and you would need a spreadsheet or program to do the sums.

So whether you need to know all this data depends on how accurate you want the answer to be.

if you are just trying to guess which of two engines will give the better acceleration (or top speed, or load carrying ability, etc) your first port of call should always be the (peak) power figure. 95% of the time this single figure will be good enough.
COMPETITION CAR ENGINEERING -Home of VIRTUAL STOPWATCH

User avatar
strad
117
Joined: 02 Jan 2010, 01:57

Re: Torque and RPM relation

Post

had to convert to foot pounds for my convenience but your 500Nm works out to 368.78 ftlbs so your HP should be like 280 where you're showing just over 200hp.
charts not quite right by like 70hp. why?
To achieve anything, you must be prepared to dabble on the boundary of disaster.”
Sir Stirling Moss

xxChrisxx
xxChrisxx
44
Joined: 18 Sep 2009, 19:22

Re: Torque and RPM relation

Post

strad wrote:had to convert to foot pounds for my convenience but your 500Nm works out to 368.78 ftlbs so your HP should be like 280 where you're showing just over 200hp.
charts not quite right by like 70hp. why?
If that's directed at my post. Power is stated in kW.
209 kW * 1.341 = 280.3 HP

I'm going to try to label the x and y coordinates so that you can enter it into excel, if you are so inclined, to my working and convert to any unit system that works for you.

CBeck113
CBeck113
51
Joined: 17 Feb 2013, 19:43

Re: Torque and RPM relation

Post

That would be the perfect "last words" before a mods stops by and locks this thread ... [-o<
“Strange women lying in ponds distributing swords is no basis for a system of government. Supreme executive power derives from a mandate from the masses, not from some farcical aquatic ceremony!” Monty Python and the Holy Grail

User avatar
dren
226
Joined: 03 Mar 2010, 14:14

Re: Torque and RPM relation

Post

Wait, what...torque is not energy??? :wink:
Honda!

User avatar
strad
117
Joined: 02 Jan 2010, 01:57

Re: Torque and RPM relation

Post

xxChrisxx.. OK.. misread since at the bottom it says HP...but on the side it does say Kw. #-o
Wasn't attacking just tryin to understand.
To achieve anything, you must be prepared to dabble on the boundary of disaster.”
Sir Stirling Moss

xxChrisxx
xxChrisxx
44
Joined: 18 Sep 2009, 19:22

Re: Torque and RPM relation

Post

Well spotted, told you more pairs of eyes tend to find errors. Picture is now edited.

flyboy2160
flyboy2160
84
Joined: 25 Apr 2011, 17:05

Re: Torque and RPM relation

Post

bhall II wrote:...."Energy" wrench
Nonononono. Everybody knows you can't measure energy with a wrench. That's a He Who Shall Not Be Named Memorial Model Energy Meter.

xxChrisxx
xxChrisxx
44
Joined: 18 Sep 2009, 19:22

Re: Torque and RPM relation

Post

At the end of the first post in this series (page8). We established that knowing the power curve without a reference speed isn't a great deal of help if we want an accurate calculation of the the tractive effort in each gear.

I'll try to roll together methods 2 and 3 into this one post.

The Goal
To find the tractive effort curves for a car with a 5 speed transmission

2. Power Curve with Tacho and Speed Reference
To get a reference speed, we can relate a road speed to a specific rpm in each gear.
To do this, we can take a reading of the road speed at a set RPM in each gear, or drive at a constant speed and measure the RPM in each gear. You will sometimes see this references as road speed/1000rpm

In this case we measured:
Gear 1 - 2.59m/s / 1000rpm
Gear 2 - 4.40m/s / 1000rpm
Gear 3 - 6.53m/s / 1000rpm
Gear 4 - 8.27m/s / 1000rpm
Gear 5 - 10.2m/s / 1000rpm

N.B. Relating road speed to engine speed in this way, is giving us the overall gearing ratio (including gear, final drive and rolling circumference).

We can now plot the power availability in each gear
Image

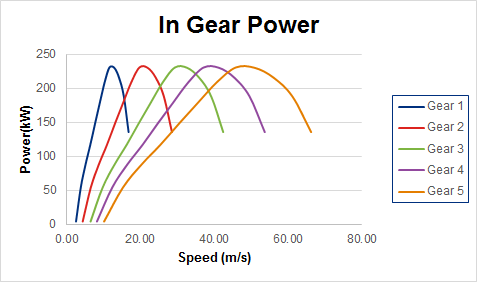
From the plot above we know the exact power availalbe at all road speeds in gear we can again use:
Power = Force * Speed

To generate the following tractive force curves.
Image
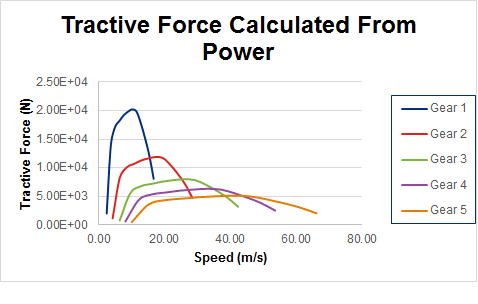
This gives a more accurate acceleration profile of the car both in each gear and throughout it's operating speed range.
Please take note of the profile of the tractive force curve in each gear.


3. Using the Torque Curve to generate tractive effort curves at the wheel
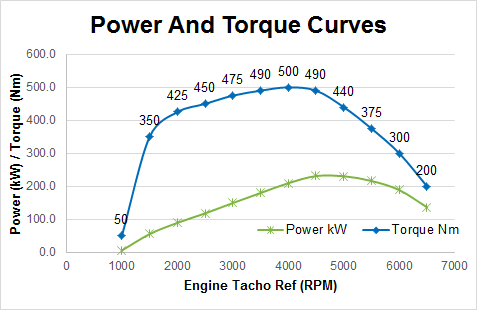
From the first post. We know the torque curve that is associated with the power curve.
Image

We can find the overall gear ratio by using the method above using reference speeds and the wheel size.
In this case Rolling circumference is 2, and by geometry the Rolling Radius is 0.31831

By multiplying the reference speeds above by 60 (to convert seconds to minutes), then deviding by 2 (wheel circuference). We can calculate the overall transmission ratio (gear and final drive) Which Gives:

Ratios
Gear 1 - 12.87
Gear 2 - 7.58
Gear 3 - 5.10
Gear 4 - 4.03
Gear 5 - 3.26

Factoring the engine torque curve by this ratio and the rolling radius we get the following traction curves:
Image

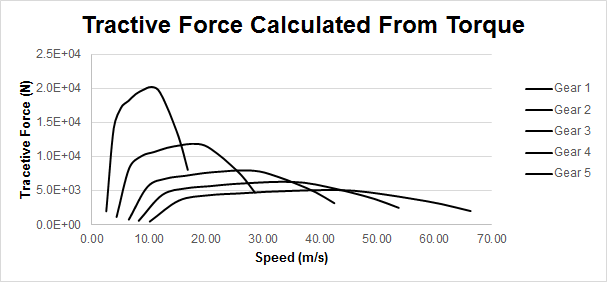
As you can see both power and torque methods produce exactly the same traction curves, so it really doesn't matter which one you use. You can simply pick the most convenient method based on the information available at the time.

It's also of interest to note that the traction curves in each gear are some function of the engine torque curve.
i.e The profile of which you accelerate in gear is the same profile as the engine torque curve.


I'll create a 3rd post. That uses some methods above to explain some of the common questions and phrases that have been used. I hope there aren't too many errors in the above post. Comments and questions welcome!
Last edited by xxChrisxx on 12 Aug 2014, 18:18, edited 1 time in total.

gruntguru
gruntguru
563
Joined: 21 Feb 2009, 07:43

Re: Torque and RPM relation

Post

Let me simplify that for you Chris. - Power - Torque - RPM. Pick any two - you can calculate the third and have the complete picture.
On the other hand:

You have a 1 ton car with 500 peak hp. - This is plenty of information to estimate its performance.
You have a 1 ton car with 500 peak ft.lb. - This information is useless.
You are driving a 1 ton car at 60 mph and the engine is generating 100 hp. - The acceleration can be estimated from this information.
You are driving a 1 ton car at 60 mph and the engine is generating 100 ft.lb. - This information is useless.
je suis charlie

gruntguru
gruntguru
563
Joined: 21 Feb 2009, 07:43

Re: Torque and RPM relation

Post

xxChrisxx wrote:At the end of the first post in this series (page8). We established that knowing the power curve without a reference speed isn't a great deal of help if we want an accurate calculation of the the tractive effort in each gear.
OTOH Knowing the power curve without a reference speed is of some use.
Knowing the torque curve without a reference speed is of no use.
je suis charlie

xpensive
xpensive
214
Joined: 22 Nov 2008, 18:06
Location: Somewhere in Scandinavia

Re: Torque and RPM relation

Post

Truer words never spoken, why the above two posts should make a fine conclusion of this thread, I know it is for me anyways.
"I spent most of my money on wine and women...I wasted the rest"

xxChrisxx
xxChrisxx
44
Joined: 18 Sep 2009, 19:22

Re: Torque and RPM relation

Post

Gruntguru will you stop saying the same --- thing over and over. More specifically repeating something I've already said back to me.

If you stop being so combative, you'll realise that we are saying the same damn thing. The difference is I am giving the explanation as to why this is the case rather than asserting it.

The worked example didn't ask for an estimate of tractive effort. It specifically asked for the actual traction through all the gears. Which has been shown you need a tacho and speed reference to use power curve as well as torque curve.


My next post was going to show that in most cases the constant power model, generally gives a reasonably accurate. However I was also going to highlight scenarios when it doesn't.

Showing both the pro's and con's of the constant power assumption.