Measuring aerodynamics at the track
As the first test for the 2019 Formula 1 season draws to a close we continue our series investigating the aerodynamics of Formula 1 cars, this time looking at how aerodynamic performance is measured at the track.
The other articles in the series can be found here:

Wind tunnel and CFD tests are performed under laboratory conditions which no matter how accurate they get remain idealized versions of reality - this can sometimes lead to issues correlating the simulated world to the track. The aerodynamicists form the largest group of engineers within Formula 1 teams, with hundreds of people split broadly into three departments:
- aerodynamicists and aero surfacers who define the geometry of the car using CAD, CFD, and the wind tunnel (the aero surfacers also take parts released by the aerodynamicists and design for manufacture parts for the car or wind tunnel model),
- CFD methodology engineers who look for ways to improve CFD capabilities, methodology, and numerical models
- and aero performance engineers whose purpose is to take the data from the aerodynamicists and translate that to the track, and vice versa analyse track data to improve the correlation to the factory.
Formula 1 cars are filled with numerous instruments which are constantly transmitting many hundreds of channels of data in real time to the pit garage and factory. In this article we will only focus on the measurement of aerodynamic forces.
Measuring aero loads
It is a relatively common occurrence in a race to hear a driver with damage complain about a lack of downforce, and for their race engineer to confirm they can “see it in the data”; so what sort of data are teams getting and how is it measured? As with much of Formula 1, the exact methods are individual to teams and are a guarded secret.
Force data
Absolute downorce in Newtons is acquired using linear potentiometers in the suspension, by knowing the spring rates and ratios of the suspension, the compressive force can be calculated from the change in ground clearance. This data is bolstered by front and rear laser distance sensors, which measure the ride height near the centreline allowing the attitude of the car to be determined more accurately. This signal path is incredibly noisy though with the vibrations from the engine and as the car bounces around the track and over kerbs and requires some sort of data fit to make sense.
Below is a comparison of the effect of car speed on ride height (HALS = Honeywell Angular and Linear Position Sensor) resulting from a static ride height change of -2mm at the front and +4mm on the rear from the Caterham F1 team (red is the base setup and green is the adapted setup). The scatter is as much as ± 15mm from the line of best fit, which in this case is a curve. The aero report shows that the change improved front and rear downforce by a uniform +8 points on the front axle and +4 to +5 points on the rear axle - more on “points” in a bit.
 Comparison of front and rear ride height change with speed for 2 car setups, from @KevTs
Aerodynamicists tend to work in non-dimensional coefficients (Cz for downforce) which are calculated from the force (Fz) using the following equation:
,
Where ρ is the density of air which is around 1.2kg m⁻³ depending on the altitude and atmospheric conditions, U is the airspeed measured with the pitot static probe on the nose, and S is the projected frontal area of the car (normally this is kept as a constant for ease of comparing different designs within the teams, typically. 1.5m² to 1.7m²). A point corresponds to 0.01 (one hundredth) of the force coefficient, so the 8 point gain in front downforce reported above, equates to a gain of approximately 325N at 240km/hr, as the force squares with speed.
As the absolute force, and therefore ride height, changes with car speed the aerodynamicists like to perform constant ride height, ergo constant speed, runs to check correlation to the wind tunnel and CFD experiments. This averages out the noise in their data acquisition, and allows the force data to be averaged over a longer time period, thus giving a more accurate measurement of downforce. Below is the result of such a test, one at 180km/hr and another at 230km/hr, with the data compared to the wind tunnel at a similar ride height. The 180km/hr run correlates to with 3 points on the front and rear, while the 240km/hr result show a 15 point difference owing to a diffuser stall (more on how that is checked to come).

 Caterham F1 constant speed aero test results and correlation report, from @KevTs.
Surface pressures
Surface pressure measurements are direct means of comparing the car to experiments, where the wind tunnel model will have surface pressure tappings in the exact locations as the car, and surface probes can be placed in the CFD for comparison. A pressure tapping is essentially a small hole in the surface, which is connected by a thin tube plastic to a pressure transducer (shown below inside the front wing).
Detalle d alojamiento en ala delantera. Caja d sensores aero y lastre en algunas ocasiones. pic.twitter.com/ZCYQqSxvuH
— Albert Fabrega (@AlbertFabrega) June 21, 2018
Surface pressure transducers inside the front wing ballast recess (20 channels plus 1 calibration line)
Modern pressure scanners have an incredibly fast response time, in excess of 20kHz, and are placed in key areas of the car, mainly under the front wing, and in the diffuser. Provided the spatial distribution of surface tappings is sufficient, the force on a surface can be determined, however, they are usually used to check for local changes in pressure which may indicate surface flow separations or significant loss of pressure, e.g. in the 2017 Abu Dhabi Grand Prix McLaren could tell that one channel in Stoffel Vandoorne’s diffuser was not working, which subsequently turned out to be a strip of tape wrapped around a strake. Like the ride height data this signal source is incredible noisy owing to small variations in ride height and aerodynamic transience and instability (see below).

Surface flow visualization
It is a common sight in F1 to see cars covered in fluorescent paint, colloquially called flow-vis. Each team will have their own recipe for flow-vis but it is primarily a mixture of a fluorescent powdered dye suspended in paraffin/kerosine oil. The oil has a low viscosity allowing it to flow over the surfaces before drying and revealing the direction and state of flow on the surface.
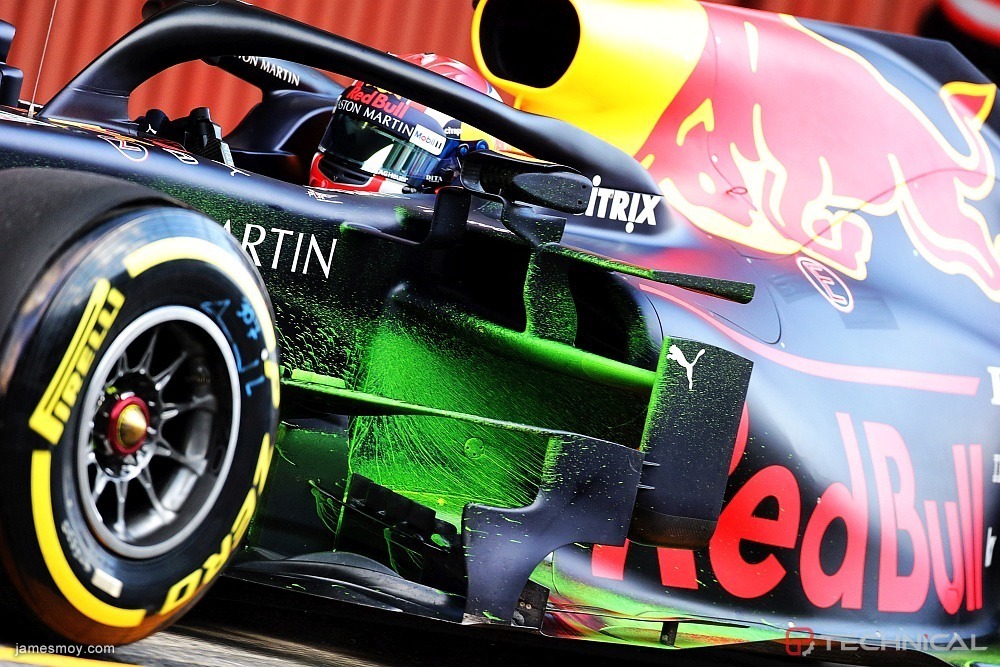
Flow-vis in the Red Bull sidepod undercut, 2019 Testing Barcelona.
Flow-vis is particularly interesting where the flow is stressed and where the state of flow may differ from wind tunnel and especially CFD studies, e.g. the trailing edges of wings and in the diffuser. It is helpful to a point, but unlike other tests it gives no value which can be accurately and directly compared to experiments.
 Example of surface flow visualisation in CFD
Here is a video of Marc Priestley (former McLaren #1 mechanic) making and testing some flow-vis around the rear spoiler of a Jaguar F-type:
https://www.youtube.com/watch?v=qaY1apFZrUE
Flow field visualization
Another common sight in winter testing, and at some practice session is the probe sensor array, or aero-rake, which is made of a number of pressure probes mounted to a frame. The probes used are typically of the Kiel type, which are a fairly robust tool and measure total pressure of the air (the sum of static and dynamic pressures). Kiel probes are single hole, so will give no indication of flow directionality, where such measurement is desired a multi-hole probe would be required. The disadvantage of a multi-hole probe is that it requires calibration to determine flow directionality, where the shrouded design of the Kiel model means flow is channeled into the probe head, and no calibrations are required.
 Comparison of Kiel (left) and multi-hole (right) pressure probe heads.
Below is an example of a typical slice through the flow field from CFD in an equivalent position to the probe array location used in testing this year. The CFD plot shows total pressure, which is the same quantity as the Kiel probe is measuring. For a more accurate comparison the exact probe points can be input into the CFD.

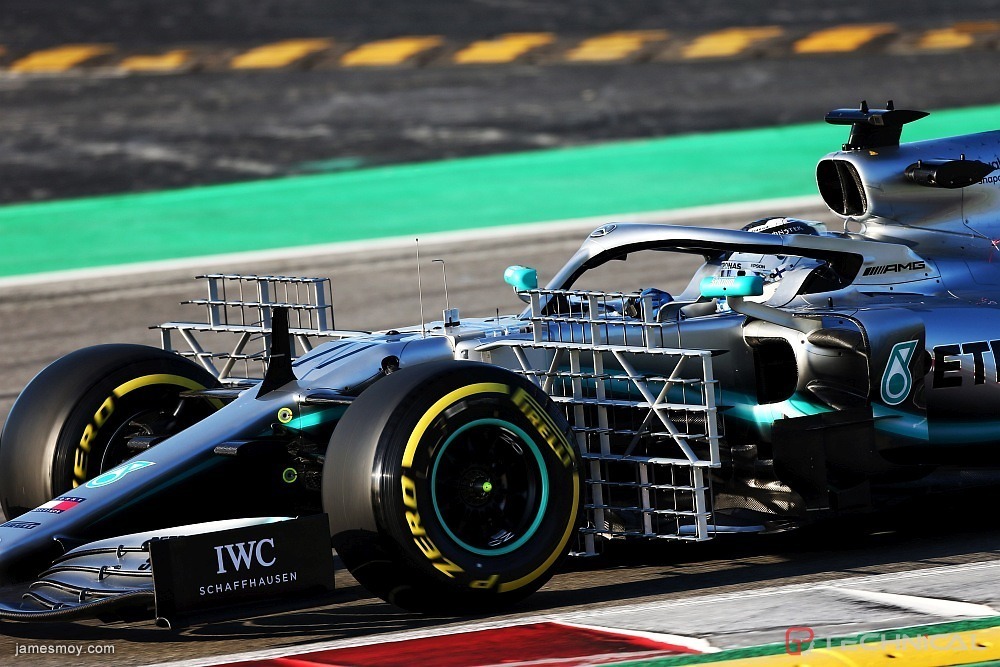
Example of total pressure (Cpo) data plotted from CFD in equivalent position behind front tyres to Mercedes Kiel probe array from Barcelona testing 2019 [James Moy Photography].

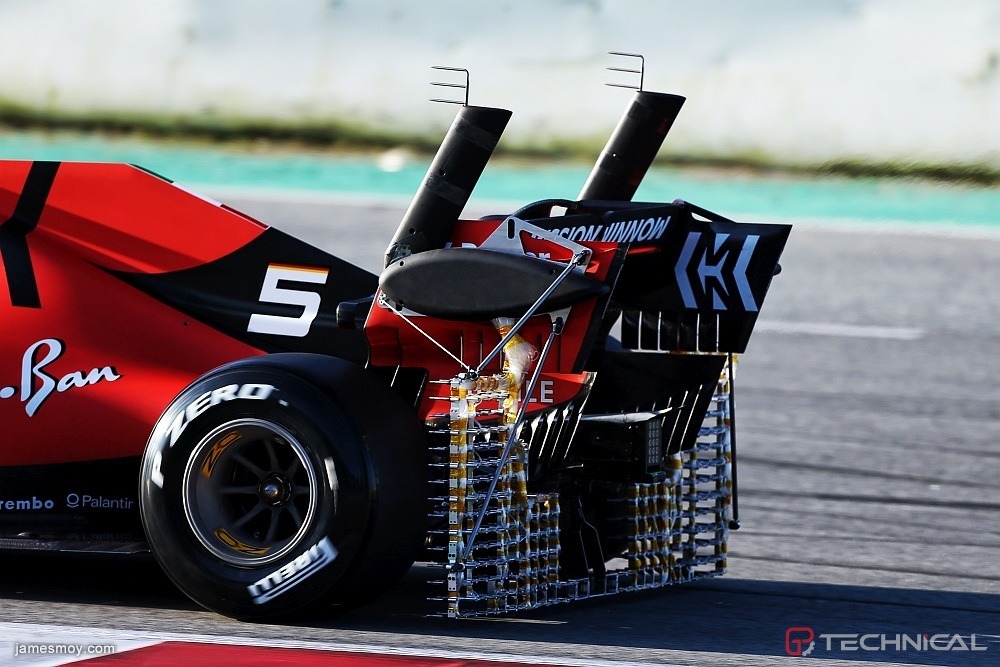
Example of total pressure (Cpo) data plotted from CFD in equivalent position behind rear tyres and diffuser to Ferrari Kiel probe array from Barcelona testing 2019 [James Moy Photography].
Hopefully this article has shed some light on some of the intricacies of aerodynamic testing in Formula 1, and how the teams use this data to correlate back to experiments performed in the wind tunnel.


