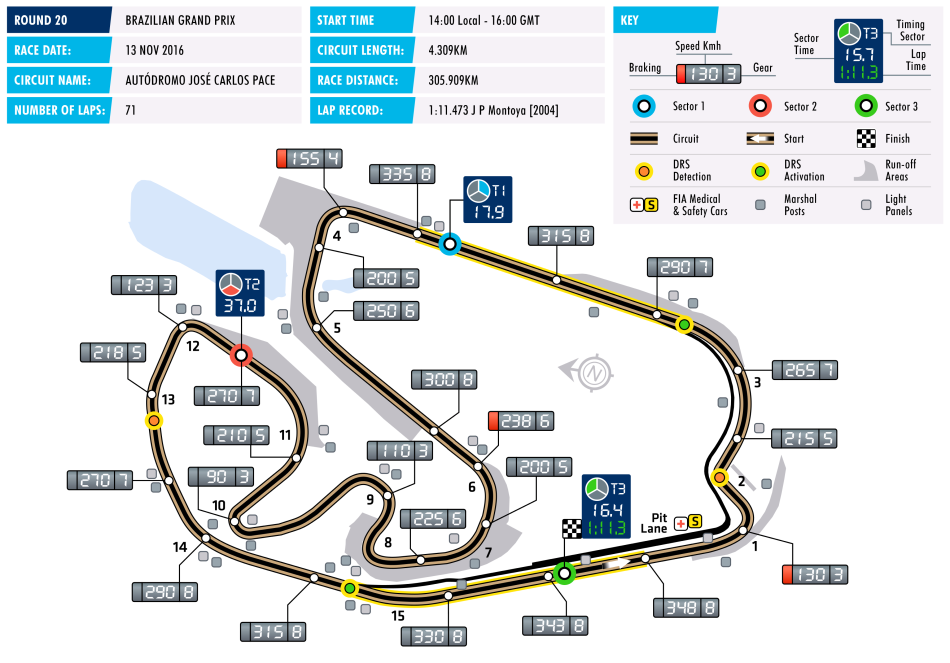
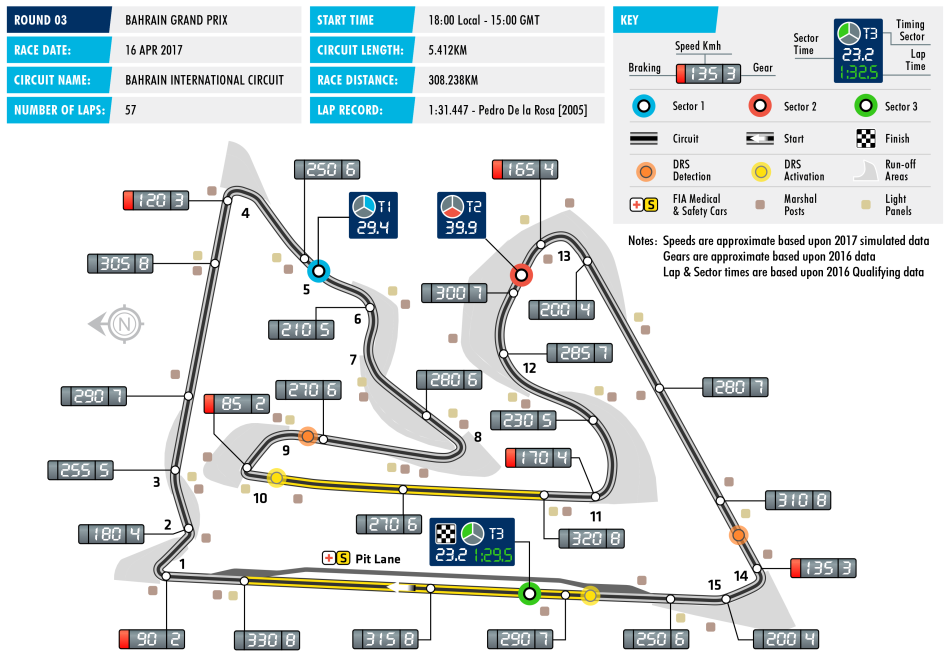
Reposting the circuit map for reference

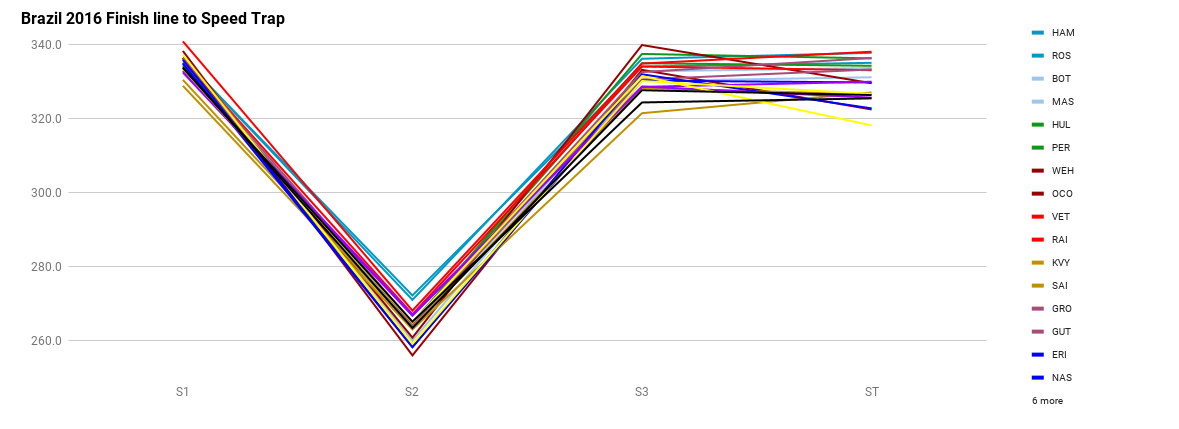
While we are looking at speeds at Brazil im going to post up a quick chart that shows the speeds at S1, S2, S3 and the speedtrap.
I apologise that it isn't very clear and if anybody has suggestions on how to improve the clarity then please pipe up, this is as best I can get it.

What has caught my eye is that the speeds recorded through the S1 speed trap are very tightly grouped and are actually faster than across the Start/Finish, in contrast to the circuit map. Also of particular interest is that the team order is somewhat different in both of these places.
At S1, Mercedes, RBR, Mclaren and the mid field are covered by 3kph, with STR hanging out the bottom a little.
At S3 (start/finish) the spread is much wider. Mercedes / Ferrari occupy the top spots then RBR then Mclaren and finally STR with the majority of the cars sitting within a 10kph range.
I think what we are seeing here is either a difference in available ERS deployment or at the very least a difference in deployment strategy. I'm leaning towards the former, with the different PU users having more or less harvesting ability than their rivals.
Looking purely at Brazil 2016 Qualy, I would say that either Ferrari have ultimately more peak BHP than Mercedes, but they are unable to sustain this as long, or they just have a different deployment strategy, either way I think they are very even. Honda look to be matching the Renault for ultimate power but have a slight deficit on harvesting. Finally Honda are beating Ferrari 15 on peak power by a noticeable margin and look like they can harvest slightly more effectively.
I think that we can also explain the difference in driver top speeds at S3, not through different drag levels but through different deployment strategies, if you look at how consistent all of the drivers are through the S1 trap, I think that those that are slowest across the start/finish have chosen to use that energy elsewhere on the lap, or alternatively, some drivers are saving deployment for the start/finish straight and therefore carry more speed across the line but must lose some time across the rest of the lap.
Finally I would look to pull your attention to the S2 trap speeds, if you refer back to the map you will see that the S2 trap is on a very short straight betwen T11 and T12. Here more than at any of the other speed traps the cars are clearly grouped by team. I have provided another chart to illustrate it better:

You have Mercedes with a big clear gap to Ferrari and RBR with a small gap to Mclaren, Haas, Force India and STR, and another small gap to Williams, Marrusia, Sauber and Renault.
I think this serves as a very good illustration of the relative strengths of each teams "chassis." The speeds are still low enough that the exit speed from T11 has more bearing on their velocity at the speed trap than the amount of bhp/drag they are running.
TLDR; Mercedes "chassis" is a bigger advantage to them than their PU. Honda PU equivalent to Renault on peak power, slightly worse on harvesting, but more power and harvesting than STR (Ferrari 2015).
I know I have turned this thread into a bit of a soap box and I apologize for that, I would just like to channel all of the energy spent bickering about Mclaren / Honda across the forum into actually testing the assertions that are being thrown around as if they were irrefutable fact. Some of them will hold up and others wont.


